The Warning Signs Your Revenue Growth Won’t Show You on the Surface
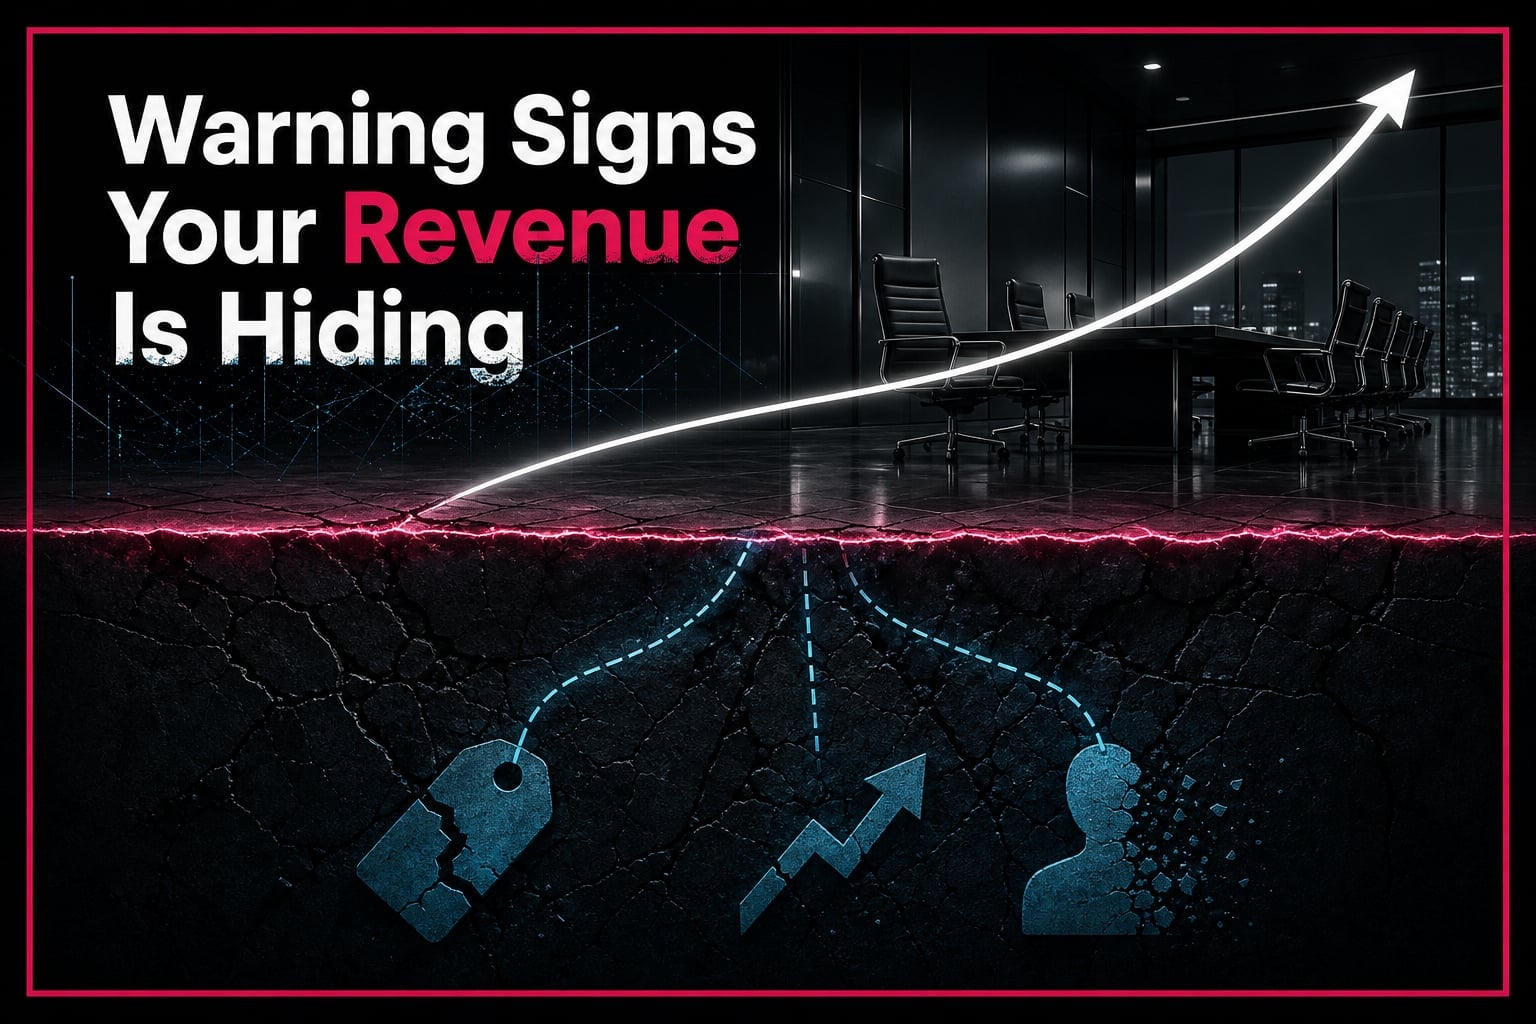
Here’s an uncomfortable fact: warning signs revenue growth hides can sit in your data for two full quarters before the topline ever dips. Your revenue chart can go up and to the right while discount dependence, rising CAC, and a fading repeat purchase rate quietly eat the business underneath it. We’re going to show you exactly where to look, and in what order.
Key Takeaways
- Three signals move before revenue does: discount rate, CAC trend, and repeat purchase rate all shift before the topline turns.
- Discounting over 20% of orders is a red flag, per Pricing Solutions, especially once it becomes routine instead of tactical.
- A 15-25% annual growth rate is considered healthy for an established company, according to DealHub, anything faster deserves scrutiny, not celebration.
- You can run the full diagnostic in 15 minutes with three reports you already have. No data team required.
What Good Revenue Growth Looks Like, and Why It’s Easy to Miss
Healthy revenue growth means more customers paying full price and coming back for more. When discounts, one-time buyers, or inflating ad spend are driving the number, the growth is borrowed, and the bill comes due.
Most leaders never see the difference because both scenarios produce the same green arrow on the dashboard. A company growing 20% on repeat, full-price customers looks identical, at a glance, to one growing 20% on constant markdowns and rented traffic.
DealHub pegs healthy annual growth for a mature business at 15% to 25%, and calls revenue growth a lagging indicator, meaning it reflects decisions made months ago, not what’s happening right now. That lag is exactly why it hides trouble.
Here’s the frame we use: good growth compounds, bad growth just repeats. Compounding growth needs less discount and less ad spend each quarter to hit the same number. Repeating growth needs more of both, every single time, just to stay flat.
Reading that gap is a skill, not a formula, which is part of what the decision-making shift that turns marketers into strategists is actually about. If your dashboard can’t tell compounding from repeating, you’re not tracking growth quality yet.
Three Numbers That Expose Bad Growth Before the Topline Cracks
Discount rate climbing past 20%, CAC rising faster than lifetime value, and a falling repeat purchase rate are the three leading indicators of demand deterioration hiding under revenue growth. Each one is measurable in your data today, no quarterly wait required.
Signal one: discount dependence. Pricing Solutions found a structural over-reliance on discounting building in firms with $50 million to $500 million in annual revenue, where a survival tactic quietly becomes the default growth engine.
Signal two: CAC outrunning value. Phoenix Strategy Group recommends keeping CAC at 25% to 33% of customer lifetime value, with payback under 12 months. Once CAC creeps toward LTV instead of away from it, every new customer adds less profit than the last one.
Signal three: repeat purchase decline. A shrinking 90-day repeat rate means new customers, not loyal ones, are propping up the topline, and new customers are the most expensive dollar you’ll ever collect.
| Signal |
Healthy |
Warning |
Critical |
| Discount rate |
Under 10% |
10-20% |
Over 20% |
| CAC vs. LTV |
CAC = 25-33% of LTV |
CAC rising faster than LTV |
CAC approaching LTV |
| Repeat purchase rate |
Flat or rising |
Declining one quarter |
Declining two+ quarters |
Stack two of these against the wrong column and the topline number stops meaning what you think it means. That’s the trap covered in metrics that look healthy and quietly wreck your brand: the number looks fine right up until it isn’t.
Run Your Own 15-Minute Revenue Health Check
A revenue health diagnostic is a quick pull of three reports that reveals whether your growth is compounding or borrowed, no dashboard subscription needed. Set a timer. This takes fifteen minutes, not fifteen meetings.
Minute 1-5: average selling price trend. Pull ASP by month for the last two quarters. Flat or rising is good. A steady decline means discounts are doing the heavy lifting your product should be doing.
Minute 6-10: blended CAC by cohort month. Line up CAC against your LTV for each new customer cohort. Southcoast Financial Partners notes that when a service line is underpriced at $1 million in revenue, doubling it to $2 million doesn’t fix the problem, it just scales it. The same logic applies to acquisition costs.
Minute 11-15: 90-day repeat purchase rate. Compare this quarter to last. Two of three signals moving the wrong way means you have unhealthy growth, no matter what the topline says.
Businesses spotting this pattern early tend to already be watching for weak signals elsewhere, the same instinct behind reading weak signals before the trend goes mainstream. If your process broke down and you can’t explain why the old playbook stopped working, start with what to diagnose first when results stop working.
Programs built by coolest.marketing walk marketers through exactly this kind of diagnostic thinking, treating growth data as evidence to interrogate, not a scoreboard to admire. Run your fifteen minutes this week, before next quarter’s number forces the conversation for you. Want the deeper version of this framework? See how the full breakdown of metrics that look healthy and quietly wreck your brand works, and check your numbers against it today.